Analytics

Data Engineering
& Analytics

We build the data infrastructure your organisation actually needs, clean pipelines, reliable warehouses, and dashboards that turn raw numbers into decisions leadership can act on immediately.

What we do

Numbers leaders
can act on.

  1. Data pipelines

  2. Data warehouses

  3. Power BI dashboards

  4. Real-time analytics

One trusted path from
raw data to action.

Most reporting problems are data problems. We build the path the data travels, so what leadership sees is clean, current and the same number for everyone.

  1. 01

    Sources

    ERP, spreadsheets, email threads, databases

  2. 02

    Pipelines

    Extract, clean and validate on a schedule

  3. 03

    Warehouse & model

    One governed dataset with agreed definitions

  4. 04

    Power BI dashboards

    Scorecards, drill-downs and alerts

  5. 05

    Decisions

    Leadership acts on a single version of the truth

How data travels from source to decision. Illustrative architecture.

Real problems.
Real solutions.

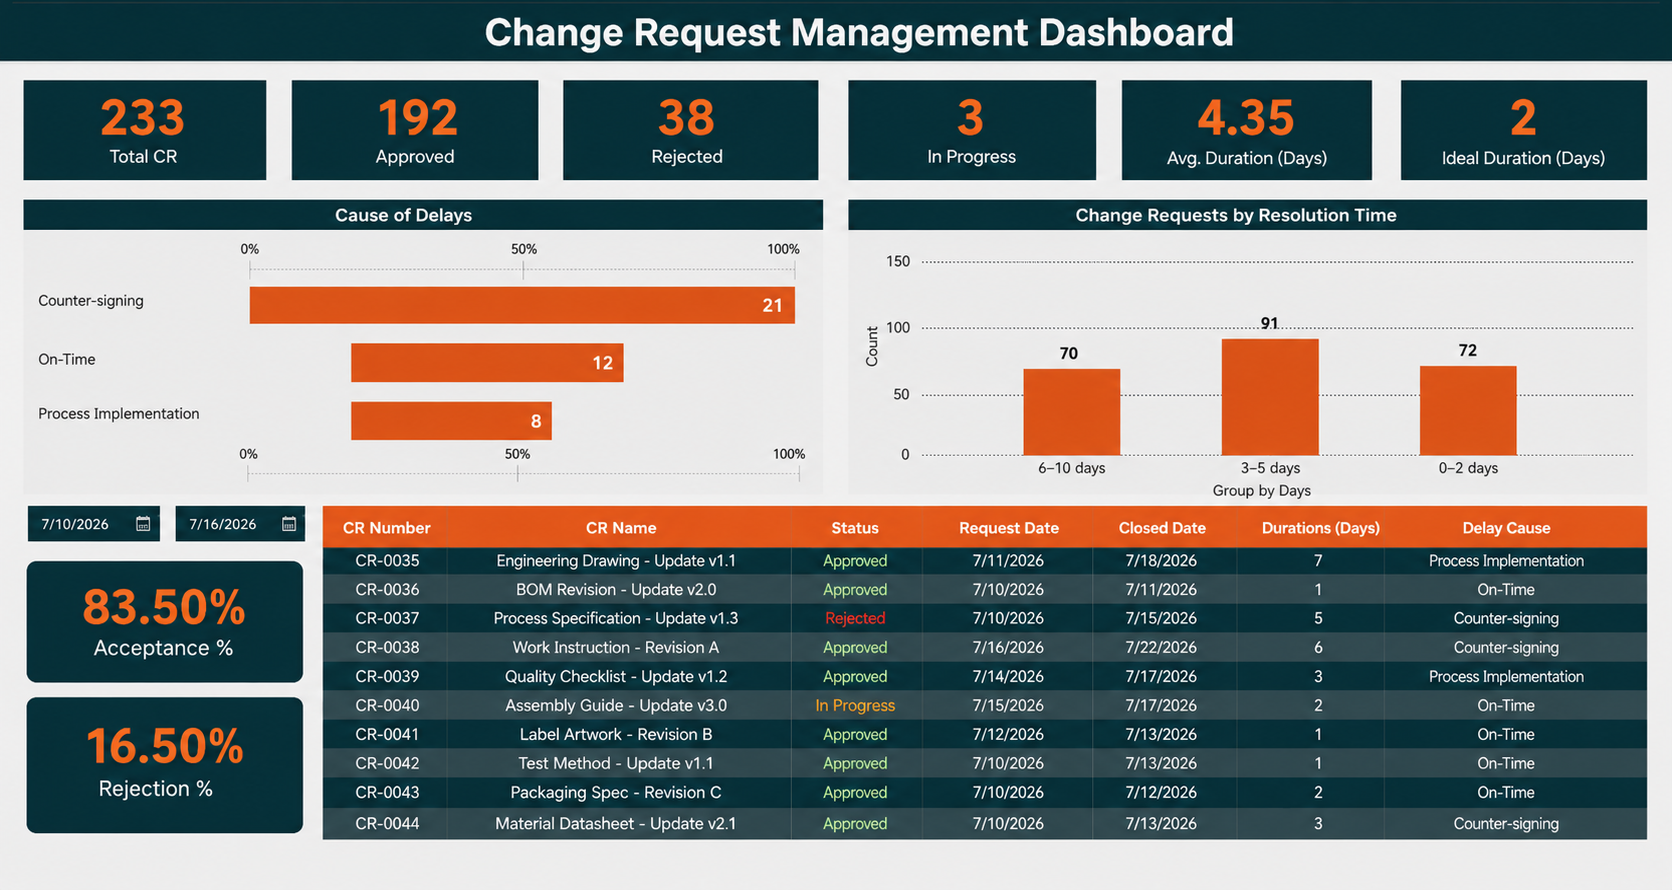
Change Request Management Dashboard: PowerBI analytics solution delivered by RhibusTech
01

Change Request Management Dashboard

Engineering & Operations

Power BI Business Intelligence Scorecards Data Modelling

Engineering and operational change requests are rarely managed in one place. Across most organisations, they live in email threads, shared drives, spreadsheet trackers, and separate approval records, each maintained by different people, updated at different times, and visible only to those who know where to look. The result is a process that is difficult to monitor, slow to respond to, and almost impossible to report on with confidence. Management cannot easily answer how many requests are currently open, which have stalled, or whether resolution times are within acceptable limits. Teams spend significant time chasing status updates rather than acting on them. This disconnect between activity and visibility is where inefficiency compounds and where the business case for centralised analytics becomes clear.

  • Centralised dashboard covering the full change-request lifecycle: status, duration, approvals, and delay causes in one view
  • Real-time visibility into approval and rejection trends with comparison against internal resolution targets
  • Delay cause analysis surfacing bottlenecks before they become critical
  • Eliminated manual status reporting across disconnected email chains and spreadsheets
02

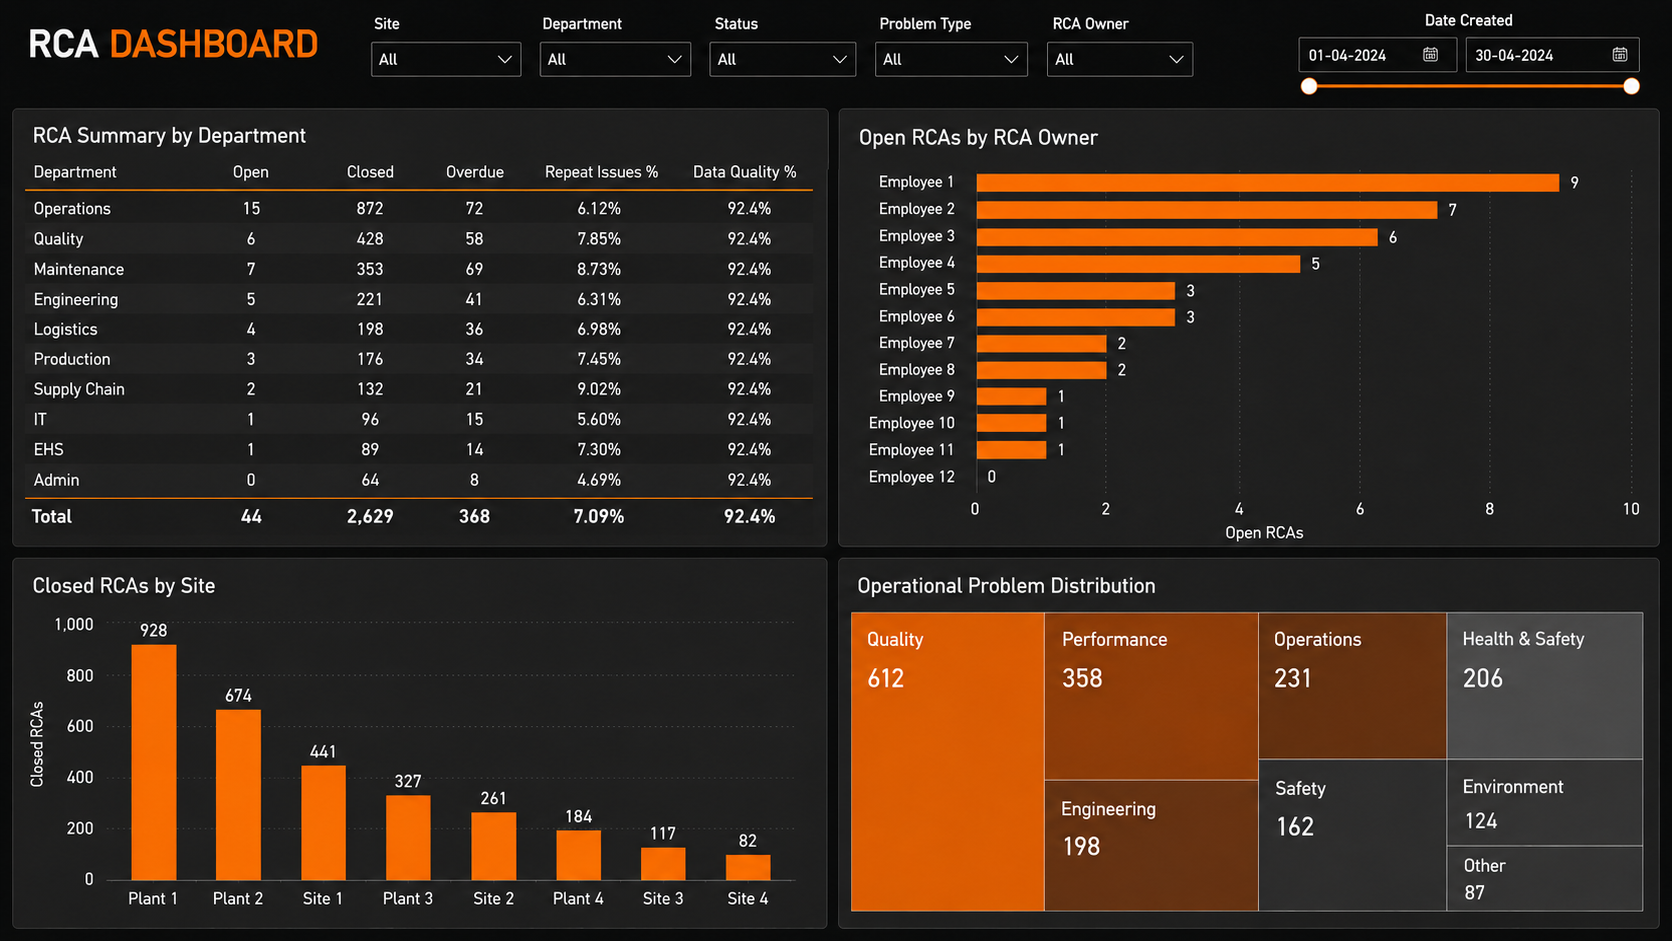
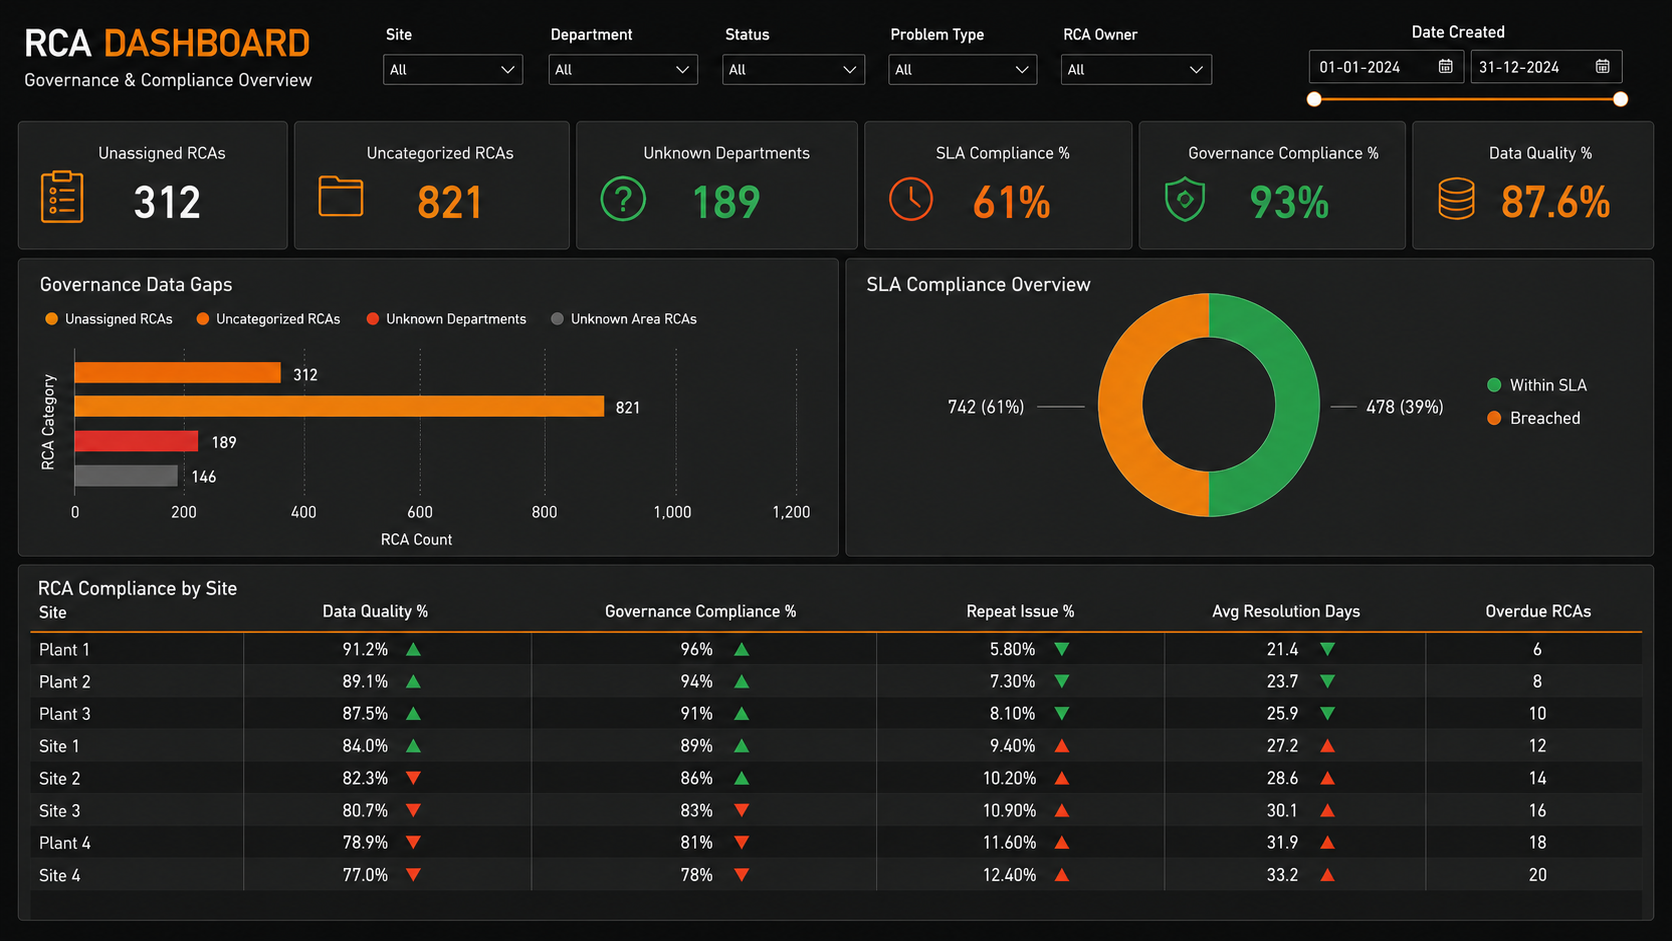
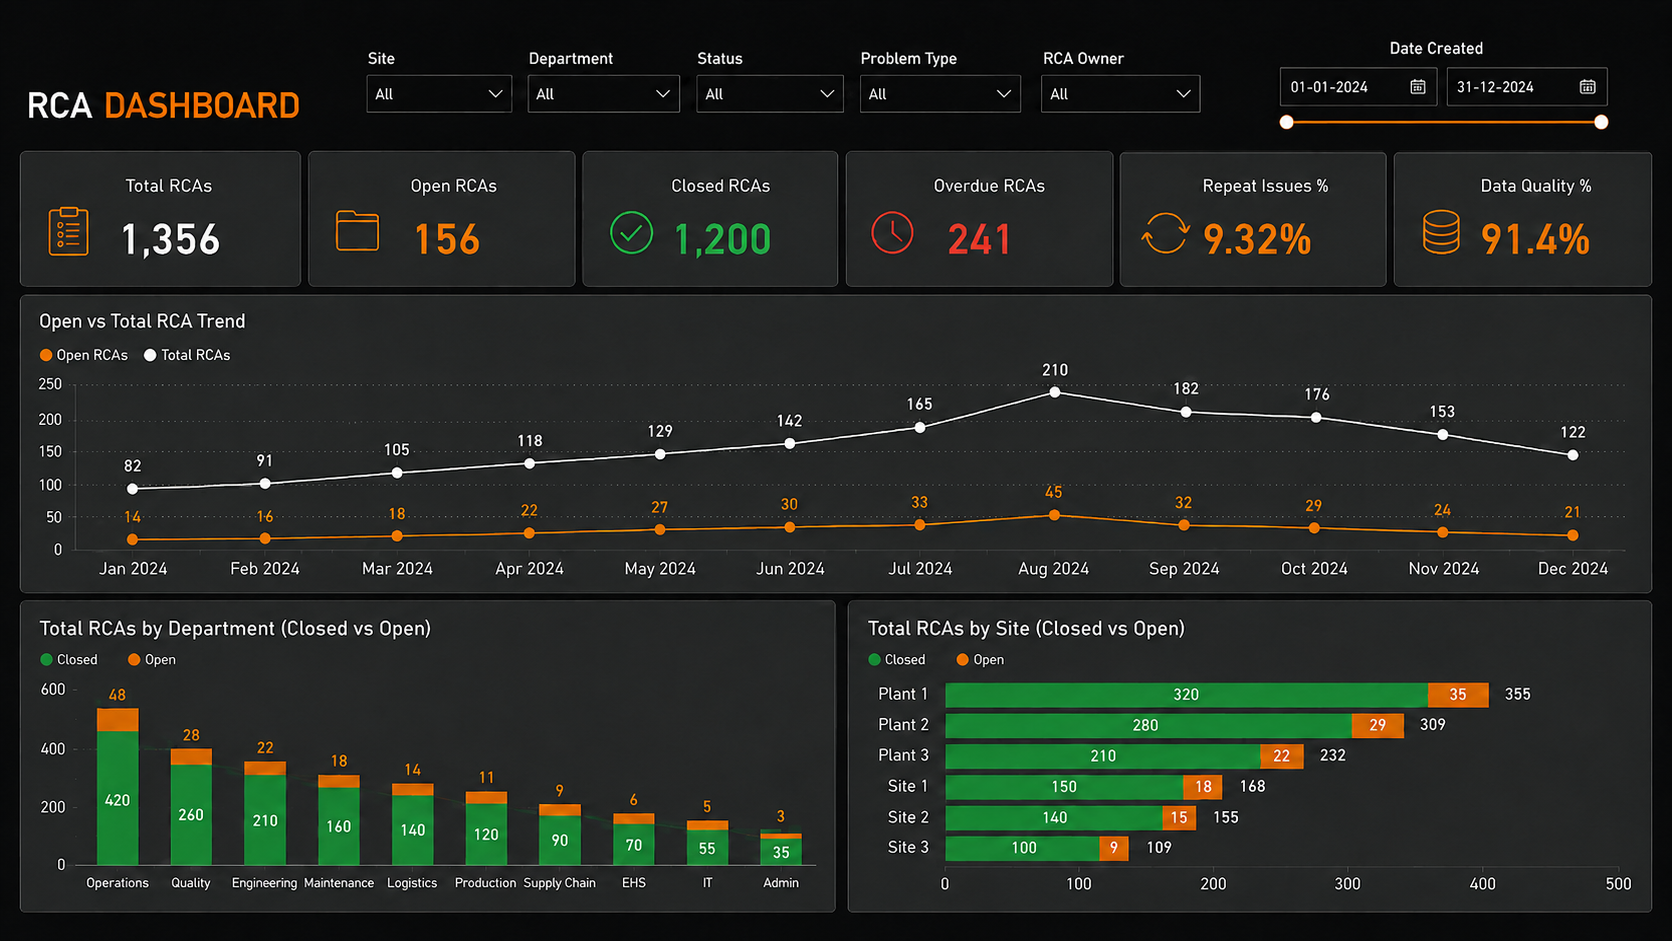
Root Cause Analysis Dashboard

Operations & Quality

Power BI DAX Data Modeling SLA Tracking Governance Reporting

Across multi-site operations, root cause analysis is rarely a controlled process. Quality investigations get opened in one system, escalated by email, assigned to owners who track progress in personal notes, and closed weeks later with no record of resolution time or prior recurrence. When the same failure pattern surfaces at three different plants under three different descriptions, nobody connects the dots. Leadership cannot answer how many RCAs are currently open, which investigations have breached their SLA closure window, or which root causes are recurring across departments. Without centralised Power BI RCA tracking, compliance reporting becomes a manual exercise and repeat failures go undetected until they become audit findings. That was replaced with fragmented process with a single governed dashboard that tracks every root cause investigation, from opening to verified closure, across every site and department in real time.

  • Centralised Power BI RCA dashboard covering every investigation across all sites: from initial logging to verified closure, replacing disconnected spreadsheets and email threads
  • Automated SLA compliance monitoring with real-time flagging when investigation age exceeds the target resolution window, eliminating missed audit deadlines
  • Cross-site repeat issue detection identifying recurring root causes before they re-escalate, reducing CAPA cycle time and preventing duplicate investigations
  • Site and department drill-down with governance scoring, giving quality managers a single audit-ready view of RCA performance across the organisation

Data and BI,
answered.

Short answers to common questions about data engineering and dashboards.

What is data engineering?

Data engineering is building the pipelines and storage that collect data from your systems, clean it and make it reliable, so that reports and dashboards are built on one trusted source instead of scattered spreadsheets.

What does a Power BI dashboard project involve?

We agree the decisions the dashboard must support, connect and model the data, build the dashboards and test them with the people who will use them. The examples on this page show two dashboards we built.

Can you replace our manual spreadsheet reporting?

Usually, yes. Automating the collection and cleaning of data removes the manual steps, and the dashboard refreshes on a schedule so leaders always see the current position.

What is the difference between a data warehouse and a dashboard?

The warehouse is where clean, organised data is stored. The dashboard is how people see and explore it. A good dashboard needs a sound warehouse or data model underneath.

More ways we can
move you forward.

YOUR NEXT MOVE

Ready to turn your data
into a strategic asset?

Tell us where you want to go. Your first 60-minute consultation is free, and we reply to every enquiry within 48 hours.